UPS monitoring Redux
Oh hi, it's 2020. How'd that happen? It's been almost 3 years since my last blog post, which was actually on this same topic.
In the time since that post, I've moved into my own house, and when that happened, I never got back around to setting up the Raspberry Pi's to monitor my UPS stats again.
I kept seeing them in a bin full of stuff, and being like "Oh yeah I should do that."
I finally decided to do it, but I never really liked the solution I had found before. Scraping NUT felt... wrong. I wanted to embrace my personal motto about work and technology: "Do better, suck less". I wanted to directly interface with the UPS, it can't possibly be that hard, can it?
Also, I haven't been keeping up with InfluxDB, either. Prometheus feels like the hot new thing these days, so I thought I'd give it a go.
I was doing some research on the internet about how to talk to a UPS directly via the HID protocol. After some searching, I came across some python that did exactly what I wanted.
Jackpot: Python? Prometheus? UPS Monitoring? It has it all.
Well, ok, not so fast.
It didn't work. I still don't know why, but for some reason it would not see the UPS plugged into my Fedora based server. I shrugged it off and decided to try on my Raspberry Pi 0W. It worked.
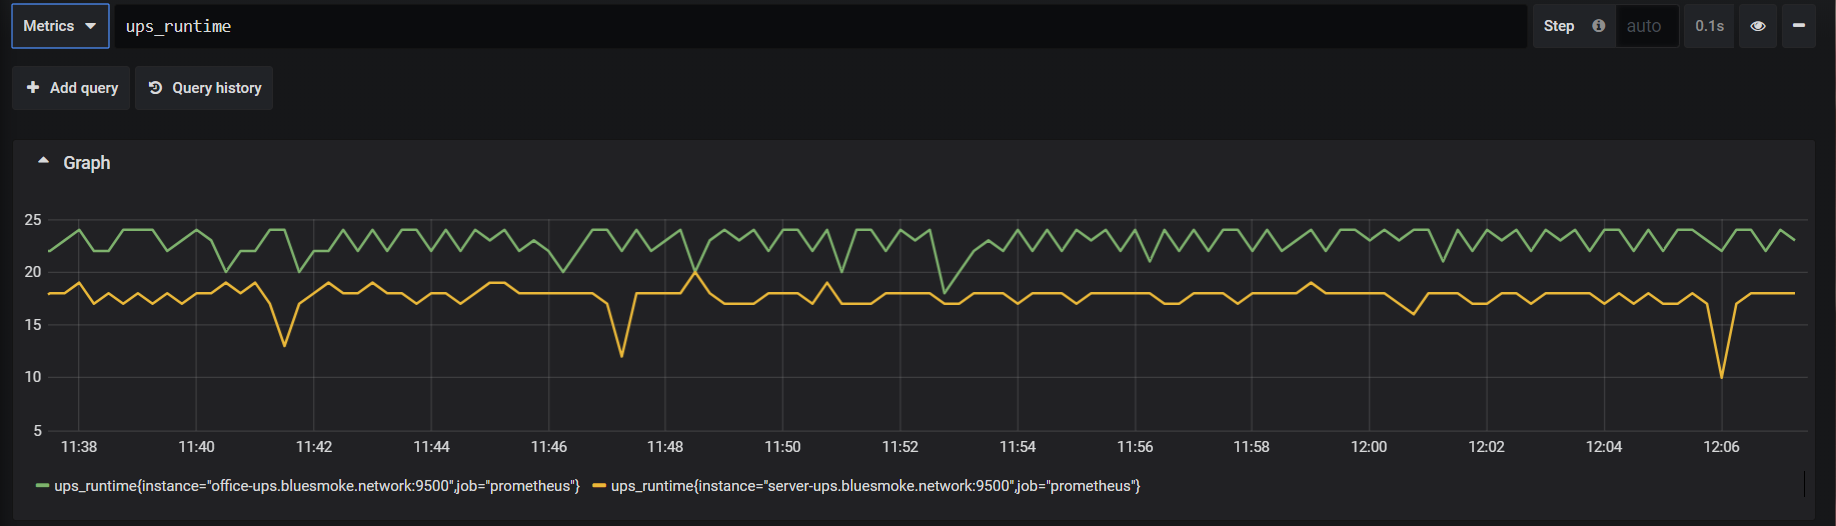
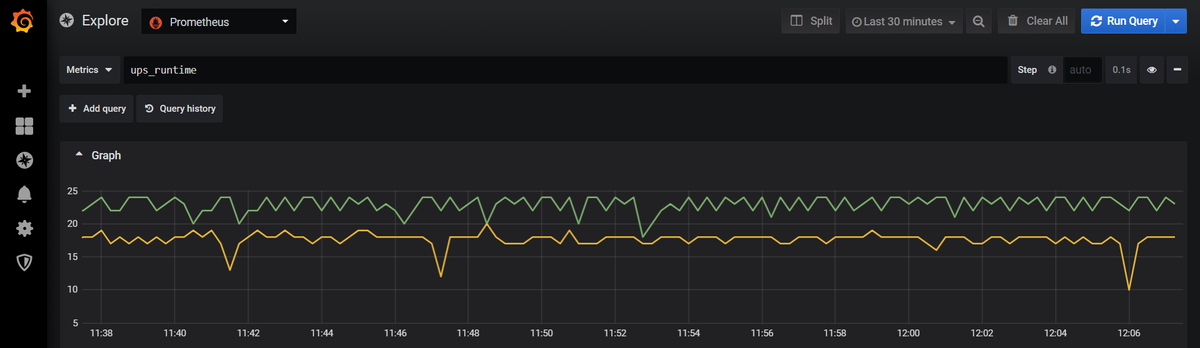
I got Prometheus scraping it (pretty standard), got grafana pointed at Prometheus, and I'm halfway home.
For history's sake, here's what I had to do to get set up (all of this as root):
apt update && apt upgrade -y
reboot
apt install git python3-virtualenv
cd /opt
git clone https://github.com/joshgordon/cyberpower-usb-watcher.git
cd cyberpower-usb-watcher
python3 -m virtualenv -p python3 venv
source venv/bin/activate
pip install -r requirements.txt
cp cyberpower-ups-watcher.service /etc/systemd/system/
systemctl daemon-reload
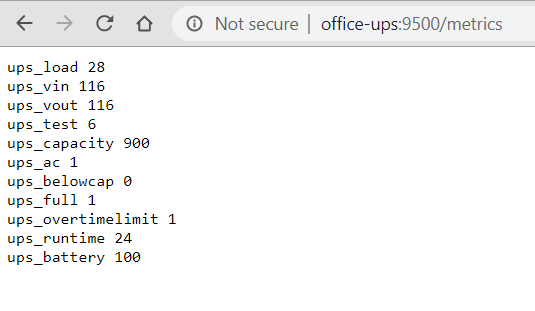
systemctl enable --now cyberpower-ups-watcher.serviceNow your UPS metrics should be available at `http://ip.of.your.pi:9500/metrics`
As you might have noticed, I started my own fork of the code, which is mostly to account for a couple of tweaks that I've made. (USB PID, and bind address are the big ones, though I took out reporting of the firmware version on mine as well because it just returned all 0's.)
I like this solution a lot better than scraping NUT or CyberPower's own UPS tools.