
Grafana/InfluxDB monitoring Power Draw (from a CyberPower UPS)
So as of recently, I've become acutely aware of the absurd amount of power I've been drawing. (mostly my desktop, which is a good 150 watts when idling... thank you nvidia. Thankfully I got the one last thing I was keeping that booted up for moved off onto my NUC, so it can spend considerably more time in the "off" state.). I was looking for a decent network-based power meter so that I could keep metrics on how much power I was drawing, when I went "You know what, my UPS has a power meter built into it... I wonder..."
Oh, how many times those words have made me stay up way too late...
Luckily for me archwiki pulls through again, and I figure out that I can pretty easily get power draw data off my UPS. I just need to install powerpanel, plug my UPS in with USB (I still need to get a longer USB cable for this... The current one is dragged across where my legs should be), start the pwrstatd service, and I'm on my merry way.
Hey, check it out, I can read out all the info that I can see from the front of my UPS and more from the command line!
[root@nuc ~]# pwrstat -status

The UPS information shows as following:

	Properties:
		Model Name...................  CP 1500C
		Firmware Number.............. BFE5107.B23
		Rating Voltage............... 120 V
		Rating Power................. 900 Watt

	Current UPS status:
		State........................ Normal
		Power Supply by.............. Utility Power
		Utility Voltage.............. 123 V
		Output Voltage............... 123 V
		Battery Capacity............. 100 %
		Remaining Runtime............ 58 min.
		Load......................... 81 Watt(9 %)
		Line Interaction............. None
		Test Result.................. Passed at 2017/07/22 21:38:46
		Last Power Event............. None
yes, 81 watts at idle. That's a NAS (not sure if the disks are spinning), a NUC, some raspberry pi's (I have like 6 running I think), and a network switch.
Now for the fun part, getting it into influxdb / grafana. Setting those guys up is a post for another day (I just did it successfully for the first time ever) Fortunately, that's pretty easy. I assembled a bash one-liner to give me the power draw in watts:
power_in_watts=$(pwrstat -status | grep Load | grep -o -P " \d+ " | grep -o -P "\d+")
and another to read out the utility voltage:
voltage=$(pwrstat -status | grep "Utility Voltage" | grep -o -P "\d+")
And then I just needed to curl them to influxdb:
curl -i -XPOST "$INFLUX_DB_HOST/write?db=grafana" --data-binary "power value=$power_in_watts"
curl -i -XPOST "$INFLUX_DB_HOST/write?db=grafana" --data-binary "voltage value=$voltage"
I started running that every 2 seconds (the whole thing is pretty fast), and then moved onto the next steps.
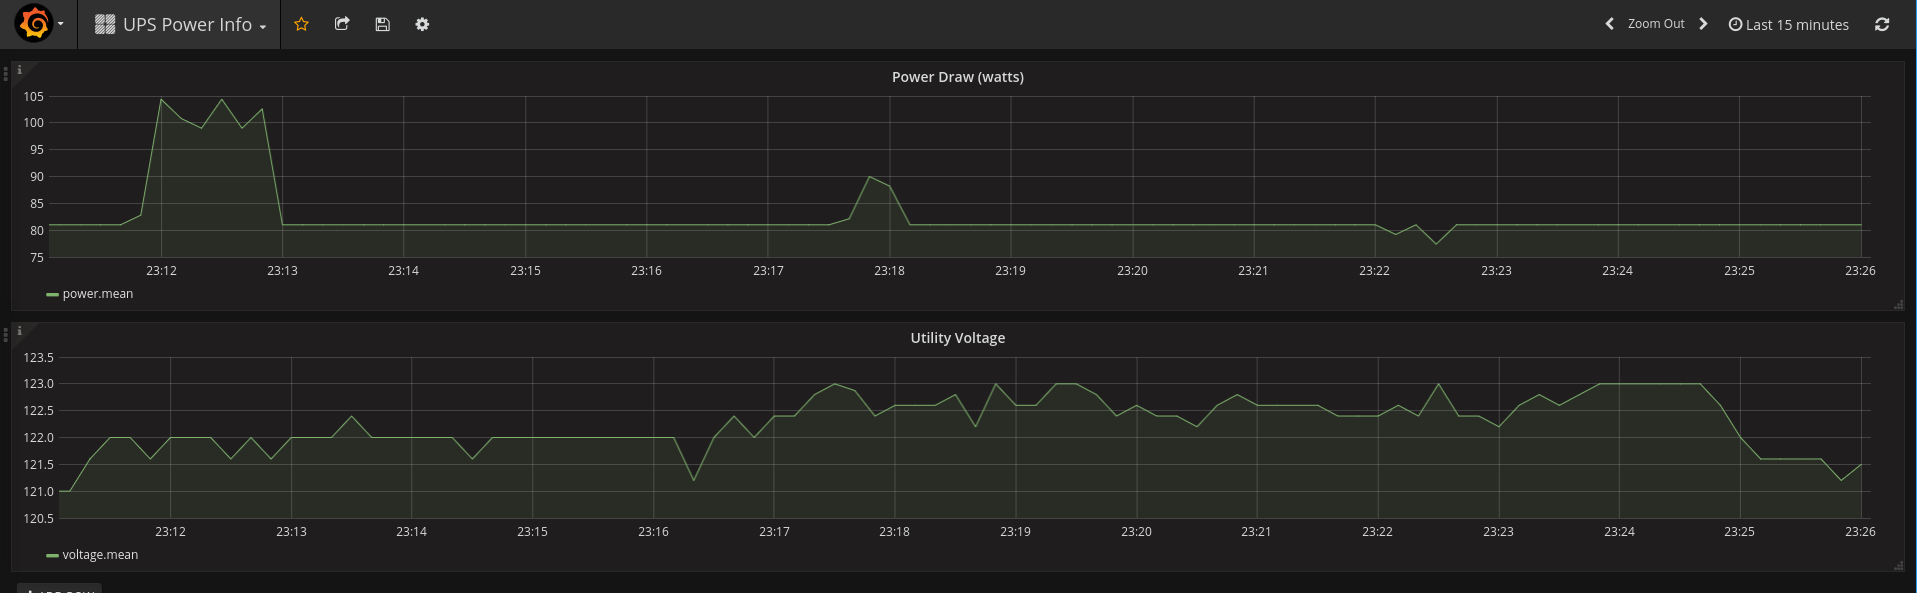
Next up, grafana: I figured out how to make a simple dashboard with some pretty graphs, and boom, it looks awesome.

(That little spike towards the beginning of the time series is me turning my lights on remotely to see the power draw spike...)
Next up is getting alerting on power failure set up, and auto shutdown of everything on my network when the power goes down... Maybe next Saturday...